Production possibility graph (ppg)
curve (ppc)
frontier (ppf)
Production possibility graph shows alternative ways to use an economy resources
Efficiency- using resources in a certain way to maximize the production of good and services
under utilization: opposite of efficiency/ using fewer resources than an economy is currently using (leads to decreased in profits)
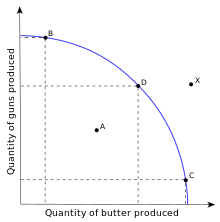
On the curve: Point D,C,B- attainable/efficient
Inside the curve(recession/famine/war): Point: A- Attainable/inefficient/underutilized/unemployment/underemployment of resources
Outside the curve: Point C-unattainable using current resources (technology or future growth)
4 KEY ASSUMPTIONS
1.Only 2 goods can be produced
2.full employment of resources
3.fixed resources (factors of production)
4. Fixed technology
Three types of movement that occur within the PPC
1.

Inside the curve
2.

On the curve (X,Y)
3.

Shifts of the PPC
Law of Increasing Opportunity Cost
When resources are shifted from making one good or service to another, the cost of producing a second item increases
When resources are shifted from making one good or service to another, the cost of producing a second item increases
Two Types of Efficiency
Productive efficiency: products are being produced in the least costly way; any point on the PPCAllocate efficiency: the products being produced are the ones most desired by society; this optimal point on the PPC depends on the desires of society
OVERVIEW OF THIS LESSON!! WATCH !!!
DISCUSSION QUESTION:
Does creating a PPC give an exact prediction of the financial status of the 2 productions?
No comments:
Post a Comment