Elasticity of Demand: A measure of how consumers react to a change in price
Elastic demand
1.demand that is very sensitive to a change in price
2.product is not a necessity
3.there are available substitutes
4.always greater than 1
ex. soda/steak/fur coat
Inelastic demand
1.demand that is not very sensitive to a change in price
2.product is a necessity
3.little to no substitutes
4.always less than 1
ex. gas, insulin
Unitary elastic
Perfect society/always equal to 1
Total revenue: total amount of money a company receives from selling goods and services
Price x Quantity = Total revenue
Marginal revenue: additional income from selling one or more unit of a good
Fixed cost: it is a cost that does not change no matter how much of a good is produced
Variable cost: it is a cost that rises or falls depending upon how much is produced
TFC + TVC = TC
AFC + AVC = ATC
TFC/Q = AFC
TVC/Q = AVC
TC/Q = ATC
AFC x Q = TFC
AVC x Q = TVC
Marginal cost = new TC - old TC
output = quantity
Equilibrium: point at which the supply curve and demand curve intersect
Excess Demand: where quantity demanded is greater than quantity supplied (shortage); consumers can not get the quantity of item they desire
Price ceiling: found below equilibrium; occurs when the government puts a legal limit on how high the price of a product can be (ex. rent control)
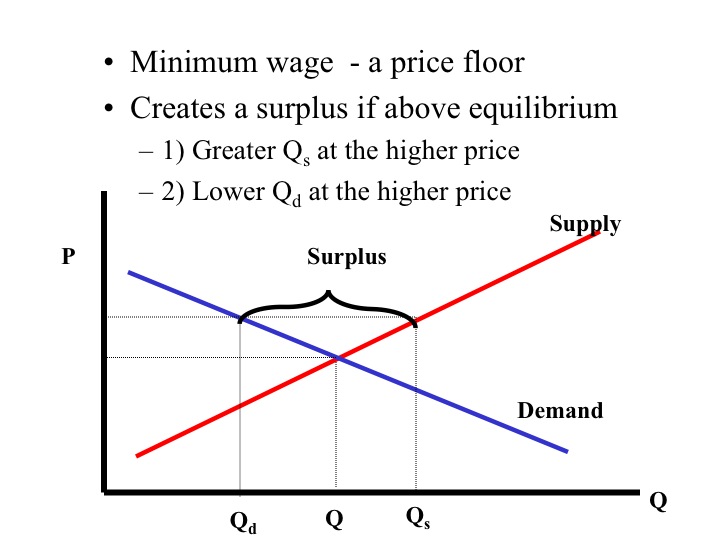
Price floor- lowest legal price of a commodity can be sold at used by the government to prevent prices from becoming too low.
QD>QS excess demands (ex.rent) shortage
QS>QD excess supply/ creates a surplus


Is a PPC an up to date representation of a countries economy?
ReplyDeleteYour blog is very well organized and detailed. In regards to the PPG graphs, do you have more examples of when the economy is in recession, or better yet, how the PPG graph shows the shift to recession?
ReplyDelete